Vehicle Travel Impact Analysis of Chestnut Protected Bike Lane
To evaluate the added bike lane’s impact on vehicle travel incorporating non-motorized traffic modes, especially including pedestrians, we built small-scale network in Vissim. The study area covers Chestnut Street from the 45th Street to 34th Street, plus north-south streets extending one block to north and south directions. Furthermore, To models travel time change in given route before and after the launch of protected bike lane. The major differences in the models for “before” and “after” scenarios included the reduction of number of travel lanes from three to two lane and the new signal plans on all the intersections in the corridor.
Data
Data needed to build the models include traffic counts for before and after scenarios for all possible entry and exit points on the corridor, turning movements on each intersection giving the exact proportion of through and turning traffic, pedestrian counts for both directs for all crosswalks and signal plans.
For the after-scenario, we collected physical counts and turning movement data and pedestrian counts for each intersection the counts were done on mid-day (between 12:00 p.m. and 1:00 p.m.) in early November, 2017. The counts were done for 15 minutes intervals and then extrapolated to get hourly counts. Since counting was conducted by different groups in separate time and day, the mismatch between the traffic volume flowing to the intersection and from the previous intersection is greatly significant. The following indicates that a significant gap between the traffic outflow of 920 vehicles from the 40th Street and the traffic inflow of 728 vehicles to the 39th Street. This difference is partly resulted the closure of one lane due to road maintenance in the segment from 39th Street to 38th Street and also some delivery trucks stopping the flow of traffic. To ensure the balance of traffic volume between input vehicle from all direction and output vehicles throughout the entire route, we adjusted turning movement data by holding the proportion of the eastbound traffic volume to outflow traffic volume in Chestnut Street. Then we adjust the left-turn and right-turn traffic counts in terms of its ratio to eastbound traffic volume, and meanwhile ensure the proportions of vehicle volume from each direction are added up to 1. Besides, for the south-north traffic volume, we keep the share of turning movement counts same and adjust the actual number of counts based on the rule of traffic balancing.

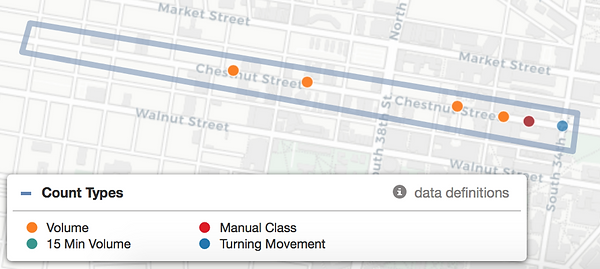
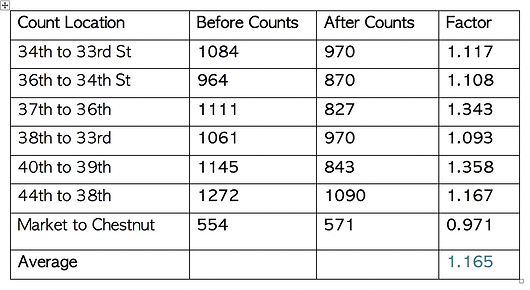
For counts before the bike lane installation we refer to DVRPC’s counts on Chestnut Street at different intersections since 2003. As demonstrated in the following figure defined by counting location, most counts are associated with eastbound traffic volume instead of turning movement data. Except for the counts which are not available, there are only 32 records of eastbound traffic volume and most of which are counted in the same location. With original traffic counts from DVRPC, we calculate the average vehicle volume for each location, summarized in the Table below. Then, compared to balanced eastbound traffic volume for the specific location, we get the ratio of before counts to after counts. Finally, by applying the average ratio of 1.165 to each turning movement data, the traffic counts before the installation of bike lane has been computed. We keep same pedestrians counts for before and after scenarios, assuming that the installation of bike lane did not affect the flow of pedestrians on Chestnut St.
We also thank City of Philadelphia for providing us the signal plans for before and after scenarios because these were the most critical input in our model. It is important to mention that the signal plans for all intersections in the bike lane corridor were changed from 60 seconds cycles to 90 seconds cycles. Signal plan from 38th St was not changed because it was 90 seconds cycle even before the installation of the bike lane.
Methodology
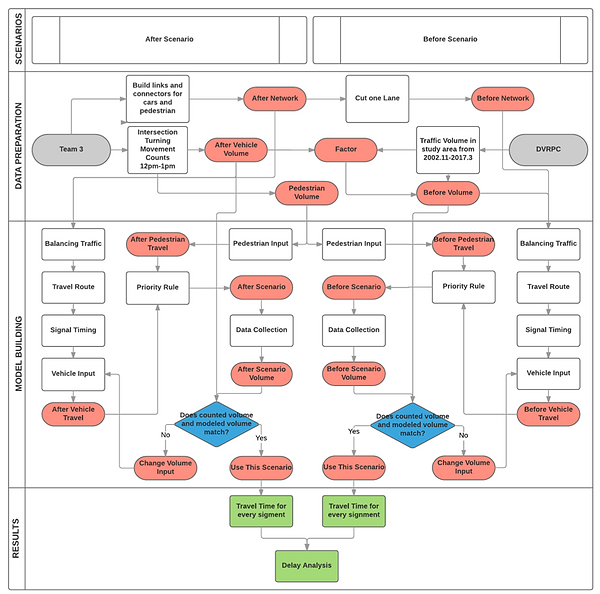
To compare the travel time for before and after scenarios, we input both vehicles and pedestrian in the model and simulate their actual travel times from one point to another within the network to get to see the impact of the bike lane. One of the difference between macro and micro simulation is that in the intersection level, little variations may lead to large difference. Therefore, we set travel route and priority rules in the network so that the effect of vehicles yielding for pedestrians could also be captured. The we calibrated the mode model by adjusting the volumes and reducing the difference between actual and simulation traffic counts to get the most realistic model for travel time calculation. The thorough methodology is shown in the diagram below.
The first thing we do to improve the simulation is to assign routes for vehicles. After balancing the traffic count, we could input the turning movements for each intersection. However, in this case, cars will only learn where to go as the reach the intersection, making unrealistic lane changes to turn. For example, cars moving on the right lane may change to the left at the intersection to make a left turn. In reality, last minute decisions seldom happen, because in most cases, people know where to go as the start their travel. Therefore, we identified all the origins and destinations in our network, calculated the turning volume share for each section and aggregated a set of OD pairs and volume share. The sum of all volume percentages for any origin should be 1. Followed is an illustration of all origins and destinations in the network (green: origin; origin: destination). Take origin 45th Chestnut street for example, all the possible routes and corresponding shares (in red) are illustrated in the following too. The sum of these numbers mounts to 1.

The calculation of these figures is done by distributing the traffic on chestnuts street. Take 40th to 39th as example again. As shown in the following figure, black numbers are balanced turning movements share for each intersection, red number is the calculated output share within this two intersections’ network, and green number is their sum (origin). Specifically, 29% of the cars from 40th Northside turn to Chestnut and the other go southbound. Among all the vehicles turned to chestnut streets, 91% of them continue heading east, and 6% turns left, 3% turns right. Therefore, in these two intersections the final distribution will be 71%, 29%*91%, 29%* 6%, 29%*3% respectively. In our network, eastbound traffic is future distributed as the reach 38th, 37th, 36th etc. intersections.

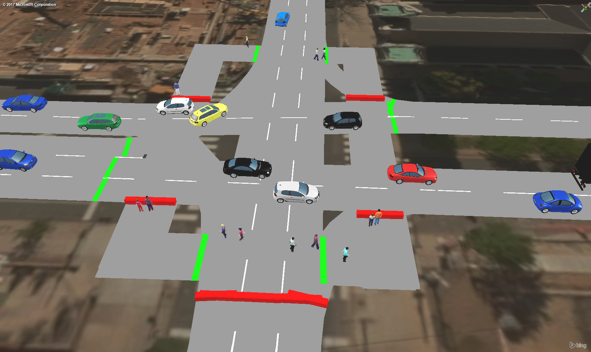
After travel routing, we input traffic volumes for each origin based on balanced counts, as well as pedestrian volumes for each intersection. Another problem came up, conflict areas exit in almost every intersection as cars making a left or right turn were conflicting with pedestrians. Therefore, we set priority rules for all the conflict areas, letting cars to yield for pedestrians. One illustration is shown in the screenshots below. The left turning yellow car is yielding for pedestrians on the crosswalk.
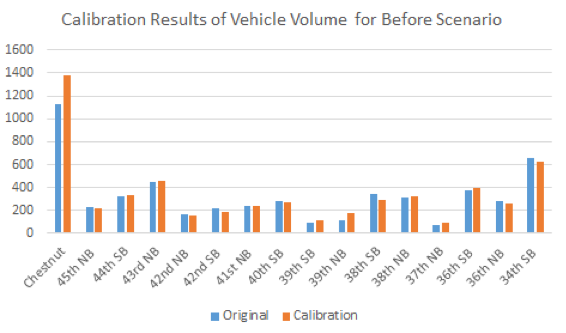
After addressing both problems, we ran the simulation and calibrated both our before and after scenarios models. As we made some changes in travel routing and the inherent nature of VISSIM, gaps exist between simulated vehicle volume and actual volume. Therefore, after building the initial model, we set several data collecting points and compare with the original volume. The model results showed that the simulation counts were comparatively lower than the actual counts, so we added 15% of the traffic on the origin point at 45th ST to fill that gap. As shown in the bar chart below.
Results
With available data and the two-built network, we use the travel time measurement tool in Vissim software to gather travel time data through the four given routes, which are illustrated in the following figure, including three types of segments. Through travel time and route length, average vehicle speed could be calculated to evaluate the bike lane’s impact on vehicle travel after the implementation of protected bike lane. As indicated in the Table below, average travel speed in the major segment of the 45th Chestnut Street to 34th Chestnut Street has reduced from 24.6 to 24.0 miles per hour by 2.7%. Speed also decreases in the segments of the 43rd Chestnut Street to 34th Walnut Street (13.7%) and 40th Market Street to 36th Walnut Street (4%). However, it is estimated that travel speed rises from 14.1 to 19.1 miles per hour when vehicles travel from 38th Market Street to 34th Chestnut Street, which could be regarded as an outlier. Therefore, it is supposed that overall vehicle travel speed might decrease along the route in Chestnut Street from 45th Street to 34th Street and its nearby south-north streets but only by a very small margin.


Discussion
By incorporating multimode in the network and taking into consideration of signals and interactions between different modes, our model is a more reliable simulation of the real time traffic. However, future improvements could be applied to the current Vissim model to improve the results. Firstly, our traffic counts for before-scenario are adjusted based on DVRPC’s count data in limited location without turning movement data, which lead to inaccurate vehicle inputs. If we can obtain more precise data of traffic counts for each intersection both from the University City District and other sources who have collected counts before the bike lane we will be able to improve the travel time and speed measurements significantly. Furthermore, the current model only incorporates the interaction between private cars and pedestrians, but this can be extended to model the interaction among cyclists, pedestrians and motorized vehicles which would simulate more realistic traffic conditions and give more authentic and reliable results.

